Social listening metrics (2026): the seven that matter, how to calculate them, and how to turn each one into a decision
Most social listening dashboards report thirty numbers and change nothing. The problem is rarely the data; it is that teams collect metrics instead of acting on them, and treat a single period's figure as if it meant something on its own. This guide is the metric-by-metric reference: the seven listening metrics worth tracking — mention volume, sentiment, share of voice, potential reach, engagement rate, trend and topic volume, and recurring conversation themes — with what each one actually measures, how to calculate the two that have real formulas (share of voice and net sentiment), and the benchmarking rule that separates a signal from a vanity number. It also draws the line the standard listicles skip: listening metrics split into two jobs. Some measure brand health and belong in a leadership report; a smaller set are content-action triggers — a rising topic, a recurring question, an engagement spike on one theme — that tell you exactly what to make next. The value of a listening metric is not the number; it is the decision the number should force, and this guide is organized around that decision for every one of the seven.
Published 2026-09-10 · Updated
Short answer
The social listening metrics worth tracking are mention volume, sentiment, share of voice, potential reach, engagement rate, trend and topic volume, and recurring conversation themes. Share of voice is your mentions divided by all mentions across your tracked competitors, times 100. Net sentiment is positive minus negative mentions over total mentions, times 100. Read each one as a trend against a fixed benchmark and tie it to a decision.
Key takeaways
- Seven metrics cover most listening needs; report only the few tied to your goals.
- Share of voice = your mentions / total mentions for you and tracked competitors x 100.
- Net sentiment runs from -100 to +100: (positive - negative) / total mentions x 100.
- Volume, sentiment, share of voice and reach are brand-health metrics for monthly or quarterly reports.
- Engagement rate, trend volume and themes tell you what to make this week.
Why do most social listening programs fail to change anything?
Most social listening programs fail at the same point: the tool collects beautifully, the dashboard fills up with numbers, and nobody does anything with it. The cause is almost never bad data. It is that teams treat metrics as a scoreboard to admire instead of a set of triggers to act on, and they read a single period's figure as if it meant something on its own. A sentiment score of 62% is not good or bad; it is meaningless until you know it was 71% last quarter. This guide is the metric-by-metric reference — what each of the seven listening metrics actually measures, how to calculate the two that have real formulas, and, for every one, the decision the number is supposed to force.
If you want the framework around these numbers — the goals, keywords, tools, and review cadence they sit inside — that lives in the social listening strategy guide, and the reactive, mention-level layer that sits below listening is covered in social media monitoring. This page assumes you have the strategy and want to get the measurement right.
How are listening metrics different from performance metrics?
Performance metrics measure content you published: the reach, likes, and clicks on your own posts, straight from each platform's account analytics. Listening metrics measure the entire conversation about your brand, your competitors, and your category — including the large majority of relevant posts that never tag you and never surface in your own analytics. Engagement rate appears in both worlds, but in listening it is measured against mentions and topics across the web, not just your feed. Keep the two in separate reports; blending them produces a number that answers no clear question.
Which seven social listening metrics should you track?
There is no shortage of things a listening tool can count. These seven cover the goals most content and brand teams actually have. Track the few that map to your goals rather than reporting all of them every period — a report with the four numbers that tie to a decision communicates more than one with thirty that don't.
1. Mention volume
The count of how often your brand, product, or a competitor is named online over a window. On its own it is the crudest listening metric, but its movement is one of the most useful signals you have: a sudden spike or dip is often the first evidence that a campaign is landing, a post is going viral, or a problem is spreading before it reaches your support queue. Volume alone never tells you whether the conversation is good — always read it next to sentiment, because a spike driven by a complaint and a spike driven by praise demand opposite responses.
2. Sentiment
The emotional tone of the conversation, classified by natural-language processing as positive, negative, or neutral across a volume of posts no human could read by hand. The standard summary figure is net sentiment: subtract negative mentions from positive, divide by total mentions, and multiply by 100 for a score from -100 to +100 (equivalently, percent-positive minus percent-negative). Neutral mentions stay in the denominator, which is why a brand with mostly neutral chatter sits near zero rather than looking negative. Its value is entirely in the trend — a line sliding from +40 to +15 over three weeks is the signal, and the drivers behind that slide are what you actually report.
3. Share of voice
How much of the category conversation your brand owns relative to competitors. The formula is your mentions divided by the total across your whole tracked competitive set, times 100: SOV = (your mentions ÷ total mentions for you and all tracked competitors) × 100. Swap in potential reach or impressions instead of raw mention counts when you want to weight by audience size. It is often the single most strategically useful number for a brand team, but only in context — measure it before and after a campaign, against a fixed competitor set, because 22% means nothing until you know it was 18% last quarter and which rival gained the difference.
4. Potential reach
An estimate of how many people the conversation about your brand could have reached — the combined potential audience of the accounts doing the mentioning. It is what separates a high-impact mention from a low-engagement one: fifty posts from tiny accounts and one post from an account with a million followers are the same volume and wildly different reach. Treat it as an estimate, not a hard count; listening tools model it from follower counts and platform data, and the point is relative comparison over time, not a precise headcount.
5. Engagement rate
How much people actually interact with the mentions and content in the conversation — likes, comments, shares, and saves — rather than just how many posts exist. It is the quality check on volume: a topic with high volume but flat engagement is being mentioned and ignored, while a lower-volume topic with heavy engagement is one people care enough to act on. For a content team it is the most direct read on which themes and framings resonate, which makes it the metric that most often points straight at what to make more of.
6. Trend and topic volume
How often specific keywords, themes, and hashtags are being discussed, and — the part that matters — whether that frequency is rising. This is the highest-value metric a content team has, because catching a topic while interest is climbing rather than after it peaks is most of the difference between a post that travels and one that arrives late. The discipline is separating a sustained climb from a one-day spike, which only consistent review reveals: a jump on Tuesday is noise; the same topic rising across three weekly reviews is a content bet. Reading these signals to anticipate demand is its own practice, covered in predicting trends with social data.
7. Conversation themes
The recurring topics, questions, ideas, and complaints that show up underneath the numbers — the qualitative layer that gives every other metric its meaning. A volume spike tells you conversation grew; the themes tell you what people were saying and why. This is where the richest content signal lives: the questions your audience keeps asking are blog and carousel topics, the objections they raise about competitors are posts you can answer, and the exact phrasing they use is language that makes your copy read native instead of corporate. It pairs directly with a structured content gap analysis.
How do you tell a signal from a vanity number?
Two habits turn all seven metrics from decoration into decisions. First, read every one as a trend line, not a snapshot. A single period's figure is close to meaningless on its own; benchmark it against the same metric last week, last month, and last quarter, and against the same competitor set each time. The number that moved is the story — a stable sentiment score is not a headline, a sentiment score that dropped ten points in a fortnight is. Second, and this is the line most listicles skip: the goal of listening is not to collect the biggest numbers. It is to spot patterns early enough that you can respond while the response still matters. A metric you watch but never act on is a cost, not an asset.
Which social listening metrics are content-action triggers?
The seven split into two jobs, and confusing them is why so many listening reports feel busy but change nothing. Mention volume, sentiment, share of voice, and potential reach are mostly brand-health metrics — they belong in a monthly or quarterly report to leadership, they answer 'how are we doing,' and you act on them a few times a year through positioning and campaign decisions. Engagement rate, trend and topic volume, and conversation themes are content-action triggers: they answer 'what should we make this week,' and their value decays in days.
Wire the second set to a fast loop. A topic climbing across your weekly review is a signal to produce a spread on it now, while interest is still rising. A conversation theme that keeps recurring — the same question, the same objection — is a specific piece of content waiting to be made. An engagement spike on one framing tells you to make more in that shape. The trigger metrics are only worth tracking if the thing they trigger can actually happen fast, which is exactly where most teams lose the loop: the signal is real and weekly, but the production is slow and manual, so the freshest opportunities go stale first.
Where does Kompozy fit in social listening?
Kompozy is a full AI content generation and multi-platform publishing engine, and its role here is narrow and specific: it lives on the far side of the content-action-trigger metrics, turning a signal into shipped content fast enough that the metric is still true when the post lands. It does not measure anything — you keep your listening tool for volume, sentiment, share of voice, and the rest. What Kompozy compresses is the distance between 'trend and topic volume is rising on this theme' and 'a full spread about it is live.'
Map it to the trigger metrics directly. When trend volume flags a rising topic, one brief through a Persona Brief generates a multi-format spread on it — text posts, document-style carousels, Persona Shorts and avatar video, images, and a blog — across the 20 output formats, with HyperFrames keeping every asset on-brand, so the topic ships the same day the metric moved rather than the following week. When a conversation theme surfaces a recurring question, that's a blog and a carousel answering it, generated from the same brief and fed the audience's own phrasing so it reads native. When engagement rate points at a framing that resonates, you make more in that shape without a fresh production cycle. Then Autopilot schedules and publishes the spread across 9 social platforms plus blog and email from one queue, behind a per-post review gate. The honest boundary: Kompozy has no opinion about which signal is worth acting on — that judgment stays with you and your metrics. It removes the throughput ceiling that makes the trigger metrics worth less than they should be.
Which social listening metrics should you actually report?
Seven metrics carry most of social listening: mention volume, sentiment, share of voice, potential reach, engagement rate, trend and topic volume, and conversation themes. Only two have real formulas worth memorizing — share of voice is your mentions over the whole category's times 100, and net sentiment is positive minus negative mentions over total, on a -100 to +100 scale. The rest is discipline: read every metric as a trend against a fixed benchmark, not a snapshot; report the four that map to your goals, not all thirty a tool can produce; and remember the point is not the biggest number but the earliest pattern. Split the seven into brand-health metrics you review quarterly and content-action triggers you act on weekly — and make sure the thing the triggers trigger can actually ship in time to matter.
What does this look like in Kompozy?
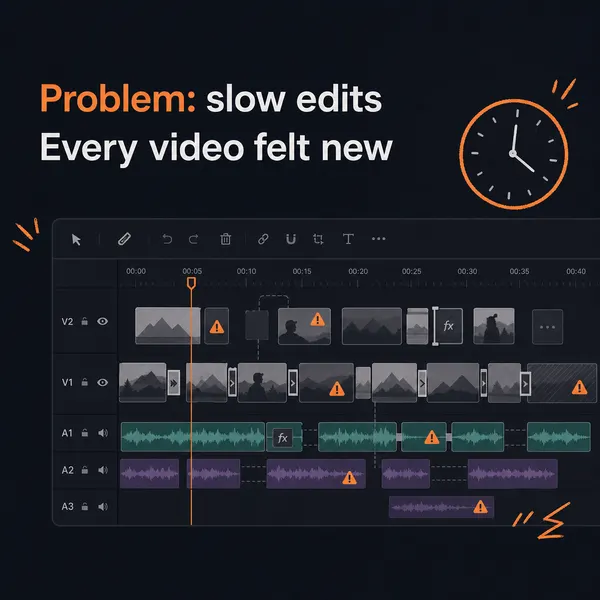
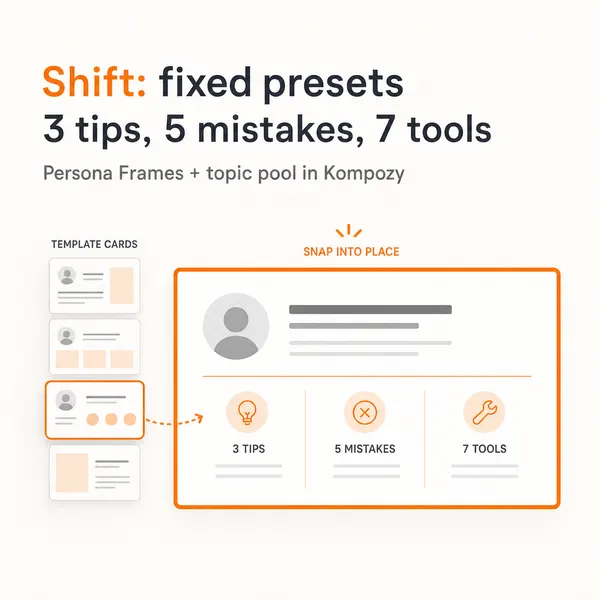
A real carousel from the Kompozy workspace. It shows the kind of post a team can make when a recurring question turns up in their listening data.



Who is this for, and who should skip it?
Best for:
- Brand and content teams who already run a listening tool but act on little of it
- Teams who need to explain share of voice and sentiment to leadership
- Content teams who want topic and theme signals to drive what they publish
Not ideal for:
- Anyone looking for a listening tool; Kompozy does not measure mentions or sentiment
- Accounts with too few mentions for trend lines to mean anything
- Teams with no way to act on a signal within a week
Frequently asked questions
What are the most important social listening metrics?
Seven cover most needs: mention volume (how much conversation is happening), sentiment (the emotional tone, read as a trend line), share of voice (your slice of the category conversation versus competitors), potential reach (how many people the conversation could have reached), engagement rate (how much people interact with the mentions and content), trend and topic volume (which themes are gaining momentum), and conversation themes (the recurring questions, complaints, and ideas underneath the numbers). Pick the few that map to your goals rather than reporting all seven every period.
How do you calculate share of voice?
Share of voice is your brand's mentions divided by the total mentions across your whole competitive set, times 100: SOV = (your mentions ÷ total mentions for you plus all tracked competitors) × 100. You can run the same formula on impressions or potential reach instead of raw mention counts if you want to weight by audience size. The single number is only useful in context — track it before and after a campaign, and against the same competitor set each period, because a share of voice of 22% means nothing until you know it was 18% last quarter.
How is a sentiment score calculated?
The common form is net sentiment: subtract negative mentions from positive mentions, divide by total mentions, and multiply by 100, giving a score from -100 to +100. Equivalently, percent-positive minus percent-negative. Neutral mentions stay in the denominator, which is why a brand with mostly neutral chatter lands near zero rather than looking negative. As with every listening metric, the trend matters more than the snapshot — a score sliding from +40 to +15 over three weeks is the signal, not the +15 itself.
What is the difference between listening metrics and social media performance metrics?
Performance metrics measure content you published — the reach, likes, and clicks on your own posts. Listening metrics measure the whole conversation about your brand, competitors, and category, including the majority of posts that never tag you and never appear in your account analytics. Engagement rate shows up in both, but in listening it is measured against mentions and topics across the web, not just the engagement on your own feed. Report them separately; they answer different questions.
How often should you review social listening metrics?
Match the cadence to the metric's job. Volume and sentiment need automated spike alerts plus a weekly read, because an unexpected jump is often the first sign of a campaign landing or a problem spreading. Share of voice and long-run sentiment trends belong in a monthly or quarterly report. Trend and topic volume and conversation themes deserve a weekly review by the content team, because their value decays fastest — a rising topic caught two weeks late is a topic you missed.
How do we know this?
We checked every figure and named fact on this page against the sources listed below on 2026-10-23, and removed or rewrote anything we could not confirm. The share-of-voice formula follows Sprout Social's definition; the net sentiment formula is the standard positive-minus-negative calculation described on the page. Kompozy product details come from kompozy.io.
Sources
- Sprout Social — Share of voice: what it is and how to calculate it (read 2026-10-23)
- Kompozy — homepage (formats, 9 platforms, review gate) (read 2026-10-23)
Get started → · ← All guides · Compare Kompozy vs other tools